

Updated: August 29, 2020
Figure 1: Monthly COVID-19 Tests to Positive Cases in Guyana
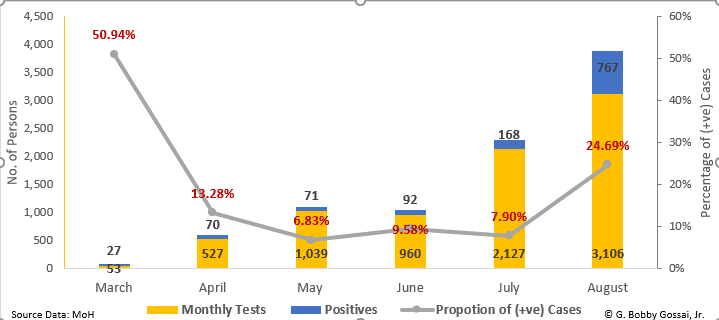
The chart above highlights the comparison between the number of monthly tests for coronavirus to the positive cases which have been recorded from March 11 to August 28, 2020. It can be seen that during August the number of tests has increased exponentially as compared to the last five months, whilst the number of positive cases has reached 767 infected persons. This represents 24.69% of all cases in Guyana, over the six months. Thus, the number of positively infected persons from July to August is 599. Moreover, it must be noted that the overall number of positive cases to date (1180) represents 15.30% of all tested persons, over the period that the coronavirus has been recorded in Guyana.
Further, the number of coronavirus tests performed over the last two months have been increasing, with July accounted for 27.23% of all tests. The month of August has seen an exponential increase in the number of tests to date; with 3,106 of such tests being performed on patients in Guyana. This represents 39.76% of the 7,811 COVID-19 tests which have been carried out over the last six months.
Additionally, on a daily basis, the number of tests being done to determine the magnitude of the coronavirus in Guyana from March to August, has been increasing. Guyana started with a daily average number of 3 test per day in March. In April, the daily number increased to 18 persons being tested. In May there was less test being done every day with around 10 persons being checked. However, in June the number of daily tests increased to 32 persons and in July the number of daily tests increased to around 69. The current daily test rate for coronavirus is around 110 persons.
Figure 2: Regional COVID-19 Confirmed Cases in Guyana from July to August
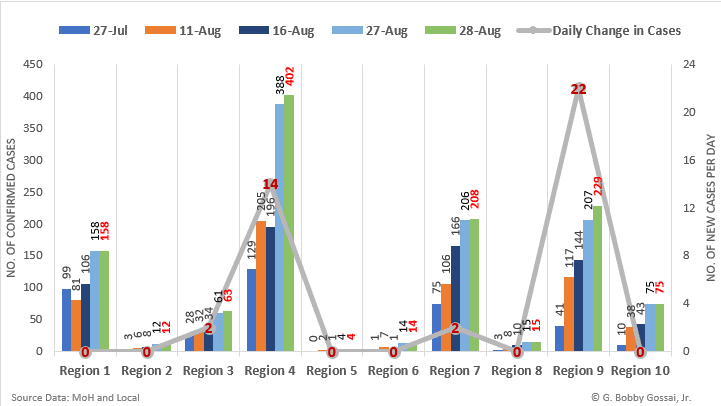
The composite chart above exhibits the trend of the coronavirus in the ten (10) administrative regions of Guyana, from July to August, along with the daily change of cases per region (August 27 and 28). It can be observed that Regions 9 and 4 had the highest daily increases of the virus, followed by Regions 7 and 3. The other six regions did not record any new cases over the two days.
Figure 3: Regional COVID-19 Cases in Guyana as of August 28, 2020
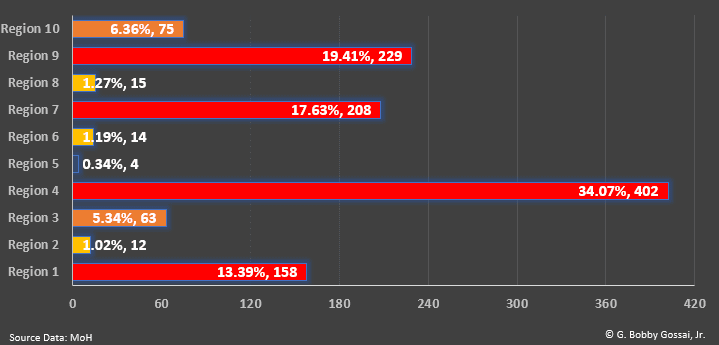
The chart above reveals that the coronavirus is most widespread in Region 4, which is accounting for 34.07% of all the recorded cases in Guyana. This is followed by Regions 9, 7, and 1 which represents 19.41%, 17.63% and 13.39%, respectively of all confirmed COVID-19 cases in Guyana. The virus is also growing in Regions 10 and 3, which have steadily increasing proportions of cases. The COVID-19 disease appears to be more manageable in Regions 8, 6, 5 and 2, with lower numbers of infections.
Forecast on Confirmed Cases
The chart below shows the forecasted situation for the coronavirus in Guyana over the next 28 days, to September 25, 2020. The predictions were done using the forecasted method of ARIMA, as a best-fit statistical analysis, given the type of data. Thus, from the current rate of growth and trend of the confirmed COVID-19 cases, as of August 28, 2020; it can be predicted that over the next 28 days, at a lower limit, the number of cases could reach 1,996 infections. However, the prediction at a median level is higher with 2,311 persons having the coronavirus, although, at the upper limit of the forecast, the number of cumulative infections could be even greater with 2,626 persons having COVID-19 in Guyana, by September 25, 2020.
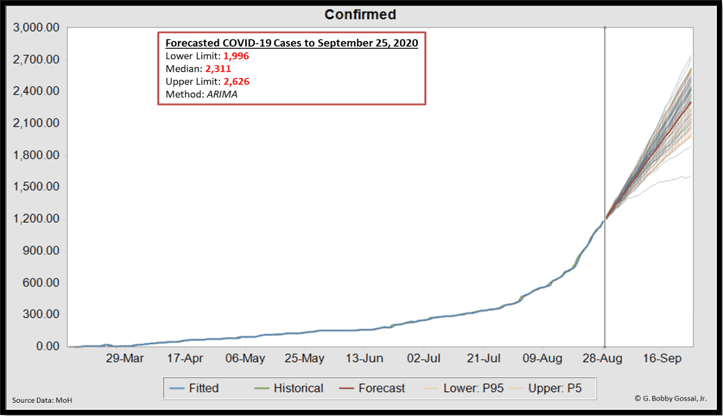
Figure 4: Forecasted COVID-19 Cases to September 25, 2020
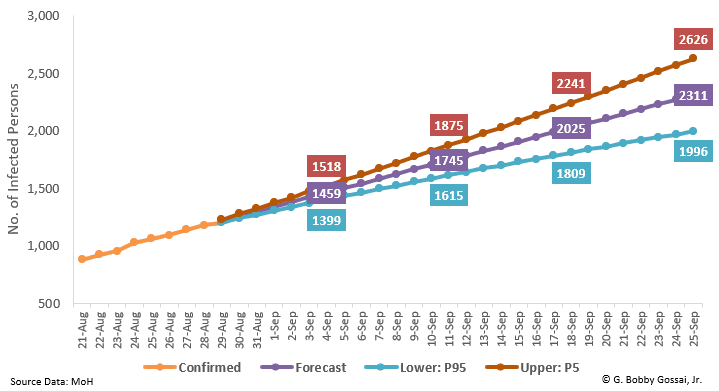
Moreover, the chart above shows the forecasted trend of the coronavirus between the prediction intervals of the upper limit and lower limit for the estimated number of expected infections over the extended period.
Figure 5: Total Confirmed COVID-19 Cases in Guyana by Gender as of August 28, 2019
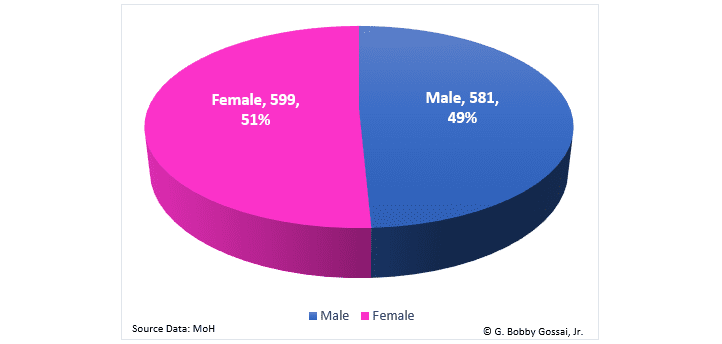
The chart above shows the gender breakdown of the total numbers of confirmed cases in Guyana. Hence, there are marginally more females who have been positively infected than males, as of August 28, 2020.
Figure 6: Monthly Positive COVID-19 Cases in Guyana
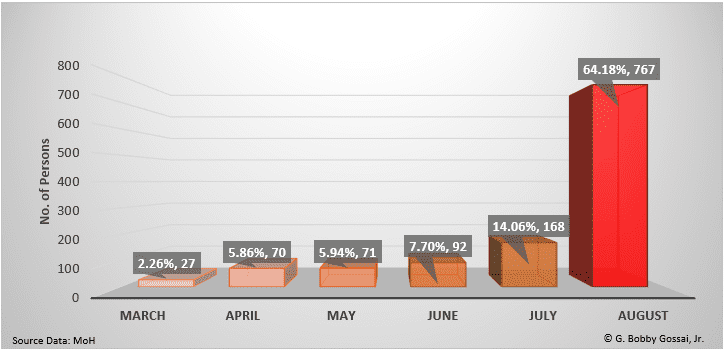
From the chart above, it has been underscored that there has been a steady increase in the number of positive coronaviruses from April to June. However, the month of July recorded more than twice the number of cases than that of June, which accounted for 14.06% of all positive cases in Guyana. Thereafter, with the increased level of testing, the month of August now represents 64.18% of all positive COVID-19 cases, to date.
Figure 7: COVID-19 Deaths per Month in Guyana
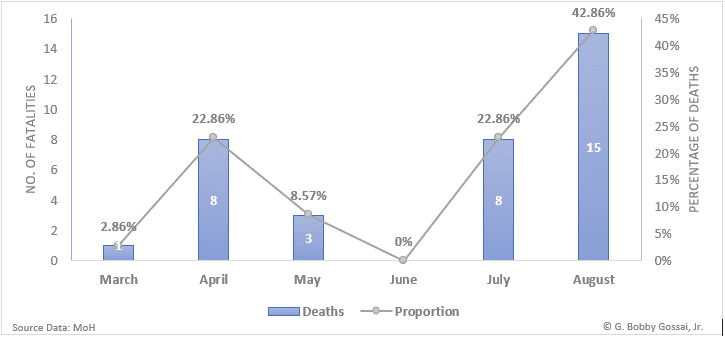
The chart above demonstrates the number of fatalities from the coronavirus over the last six months, as well as the proportion of deaths within each period. The month of June recorded no fatality, whilst April and July both recorded 8 deaths each. The month of August is proven to be the deathliest period for the COVID-19 patients with 15 recorded casualties to date. This represents 42.86% of the total number of deaths which is currently at 35 losses.
Forecasts on the Daily Positive Cases
Using the series of current data for the number of daily positive cases of COVID-19 in Guyana, a forecasted method of ARIMA has revealed that the current rate of infection could add between around 22 more new cases, at a lower limit, 42 to 43 more new cases, at a median level or 63 to 64 newly infected persons, per day, at an upper limit, by September 25, 2020.
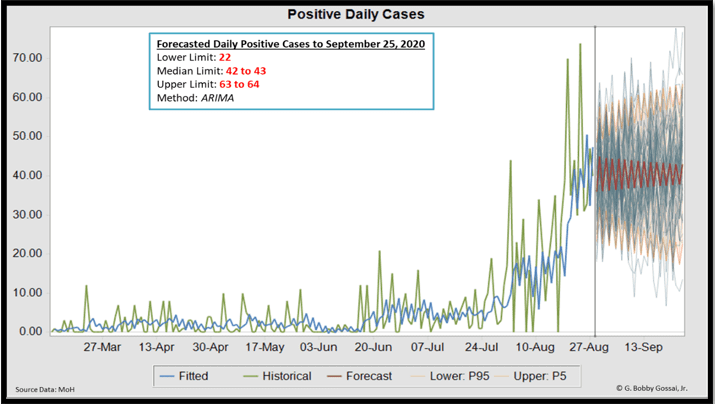
Figure 8: COVID-19 Monthly Recovered Cases for Guyana
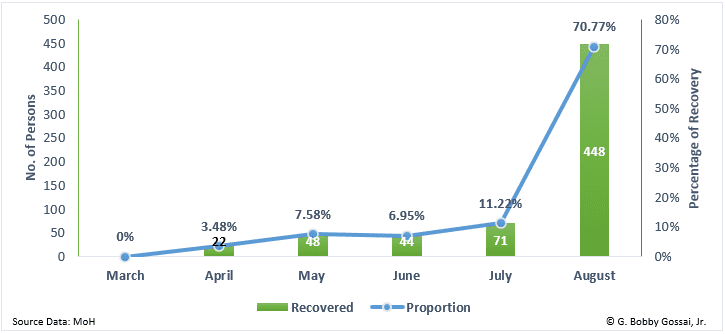
Whilst the number of positive cases has been rising rapidly, so has the number of recovered cases, for August, as is emphasized in the chart above. The month of August has seen 448 persons recovering from the coronavirus in Guyana. This is representing 70.77% of the 633 patients who have fully recovered from the virus, over the last six months.
Figure 9: Confirmed vs Active COVID-19 Cases in Guyana
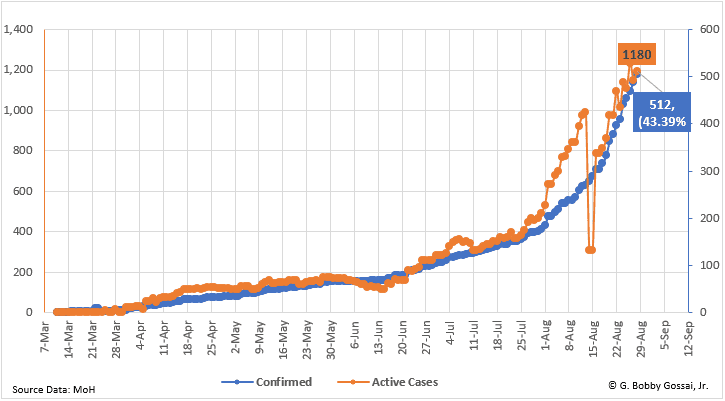
The chart above shows the number of COVID-19 cases in Guyana from March 11, 2020, to August 28, 2020, as reported by the Ministry of Health. The chart illustrates the cumulative daily number of persons who have been tested and the total number of confirmed cases in Guyana for the reported period. At the current date, Guyana has a confirmed number of 1,180 persons who have been infected with the virus of which 512 are currently active. The number of active cases accounts for 43.39% of all confirmed cases in Guyana.
Figure 10: Guyana’s Coronavirus Healthcare Status with Active Cases
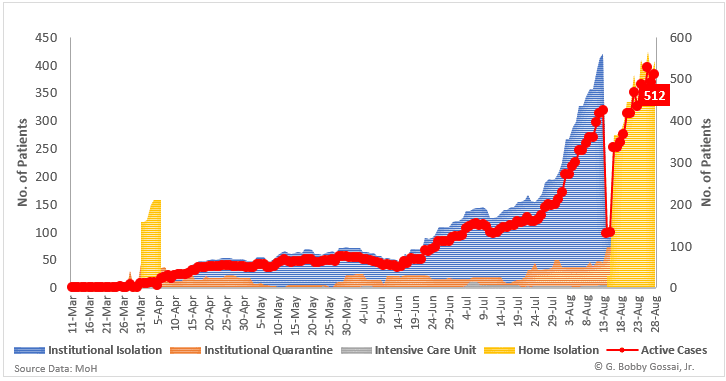
The composite chart above highlights the trend of the healthcare status of patients who have contracted the coronavirus, along with the number of active cases, from March to August 28, 2020. The average number of patients at institutional isolation has been growing on a daily basis since March. The average daily number of persons at a hospital in isolation with coronavirus in April was 37, for May it was 61, for June it was 73, for July it was 151 and as of August 28, it amounts to 196 persons. However, the average daily number of persons who were kept in institutional quarantine have been fluctuating. In March, on a daily average basis, around 4 persons were in institutional quarantine, in April there was an increase to about 22 persons per day, whilst for May the number had dropped to around 7 persons per day and it increased in June to around 20 persons on average per day.
Further, July saw an increase to 23 persons per day who were in institutional quarantine. The month of August is currently recording 60 persons per day in institutional quarantine, which is far greater than any other period. Moreover, the number of persons who are in the Intensive Care Unit with coronavirus for May were about 2 per day, in June there was at least 1 person in the ICU every day, in July the daily average of ICU patients had increased to around 5 and the month of August currently has about 6 patients per day in ICU. In addition, there are now around 304 patients who are in home isolation on a daily basis. As such, the daily average number of active cases in Guyana has been increasing from around 1 person in March to 37 in April, then to 62 in May, then to 75 in June, then to 155 in July and now to 364 persons per day in August.
Figure 11: Reproduction Estimate for Guyana
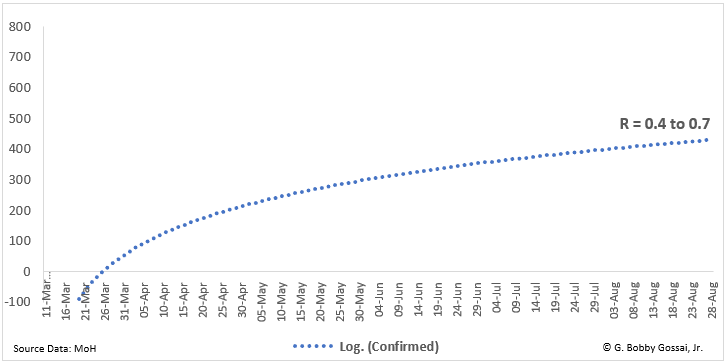
The reproduction number (R) is the average number of secondary infections produced by 1 infected person. The estimated R for Guyana was done using the number of confirmed cases over the given period of March to August and by applying a logarithmic model. The growth rate reflects how quickly the number of infections is changing day by day. It is an approximation of the change in the number of infections each day. If the growth rate is greater than zero (+ positive), then the disease will grow. If the growth rate is less than zero (- negative) then the disease will shrink. The R estimate from the data for Guyana has been estimated be around 0.4 to 0.7 over the measured period.
Figure 12: Cumulative COVID-19 Cases in Guyana
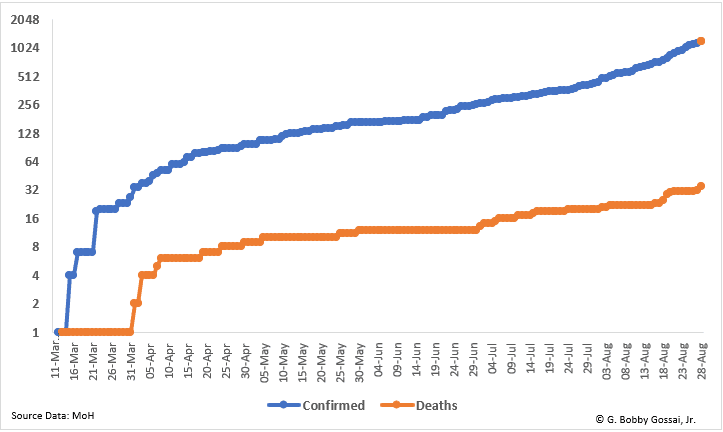
The chart above demonstrates the cumulative number of COVID-19 cases in Guyana over the period of March to August. It depicts the trend of growth of the coronavirus over a logarithmic scale to show the development of the virus over time. As can be seen from the trend-line of the confirmed cases, the curve for Guyana is at a rapidly increasing phase since June 15, 2020.
In March, the daily average increase in confirmed cases from the total number of persons tested was 30.9%. Whilst for the month of April, the daily average increases in confirmed cases from the total number of persons tested were reported to be 7.1%. The month of May showed a daily average increase of 2.1% in the number of confirmed cases from the total number of tested persons. The daily average increase in the number of confirmed cases for June was 1.6% from the total number of persons who have been tested, whilst for July it was 1.7%. The current average daily increase in confirmed cases for August is 3.8% from the reported statistics.