

The coronavirus has now spread to 190 countries with more than 9 million confirmed cases and more than 470,000 deaths. The highest official case counts are in the US, Brazil, Russia, India, UK, Peru, Chile, Spain, Italy, and Iran. Economist, Bobby Gossai Jr. takes a look at the number of confirmed cases, tests done and other metrics in Guyana, South American’s newest oil producing country, since the first recorded COVID-19 case in March.
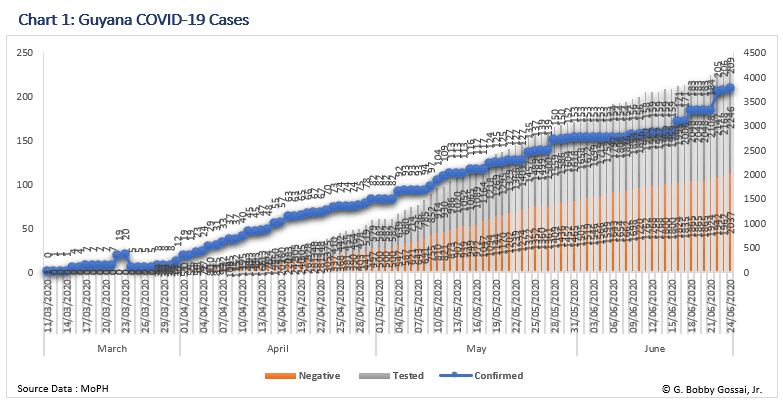
The chart above shows the number of COVID-19 cases in Guyana from March 11, 2020, to June 24, 2020, as reported by the Ministry of Public Health. The chart illustrates the cumulative daily number of persons who have been tested and the total number of confirmed cases in Guyana for the reported period. At the current date, Guyana has tested 2,246 persons for the virus, from which there have been a reported total of 209 persons who have contracted the novel coronavirus. The total number of reported negative cases from the tests, during these months, is 2,037.
In March, the daily average increase in confirmed cases from the total number of persons tested was 30.9%. Whilst for the month of April, the daily average increases in confirmed cases from the total number of persons tested were reported to be 7.1%. The month of May showed a daily average increase of 2.1% in the number of confirmed cases from the total number of tested persons. The current daily average increase in the number of confirmed cases for June is 1.3% from the total number of persons who have been tested.
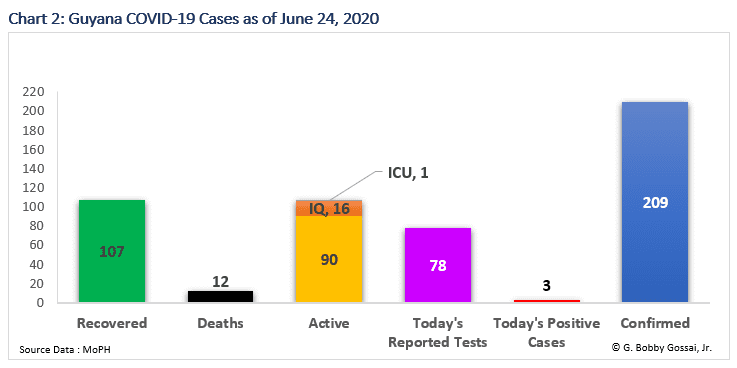
The chart above highlights the current COVID-19 situation in Guyana as of June 24, 2020. There is a total of 209 confirmed cases in Guyana to date. From the time of the first reported case to the current date a total of twelve (12) persons have lost their lives from the virus. Guyana has seen 107 persons being fully recovered from the novel coronavirus from March to June. Currently, in Guyana, there are 90 active cases of COVID-19, as reported by the Ministry of Public Health; of which sixteen (16) of those persons are in institutional quarantine and one (1) other person is in a more severe state within the intensive care unit. On June 24, 2020, there were three (3) new positive cases of the virus in Guyana.
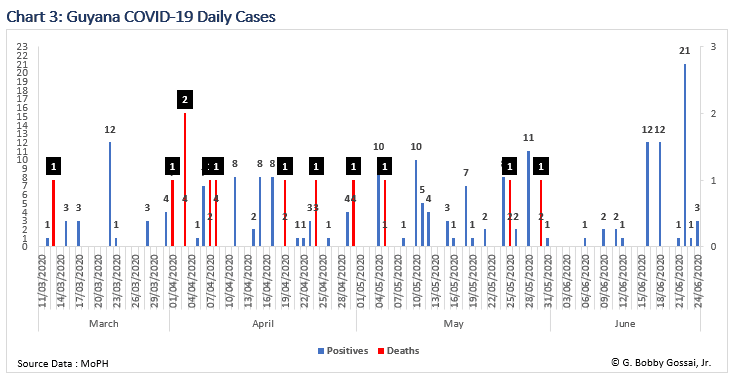
The chart above illustrates the daily number of cases in Guyana. The chart highlights the daily confirmation of positive cases and the daily deaths which have been recorded from the virus during the period of March to June. For the current month, there were two days where 12 persons each were confirmed as positive. This month has also recorded the single highest daily number of 21 positive cases.
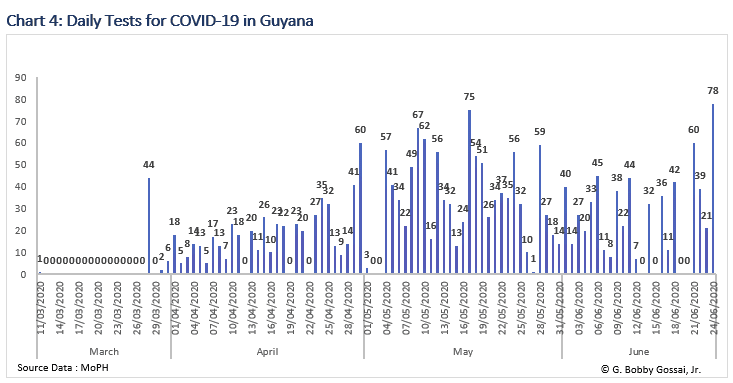
The chart above demonstrates the number of daily tests which have been done to determine the magnitude of the coronavirus in Guyana from March to June. For the current month, 628 tests have been conducted with the highest daily number of tests being performed on 78 persons, for the entire period from March.
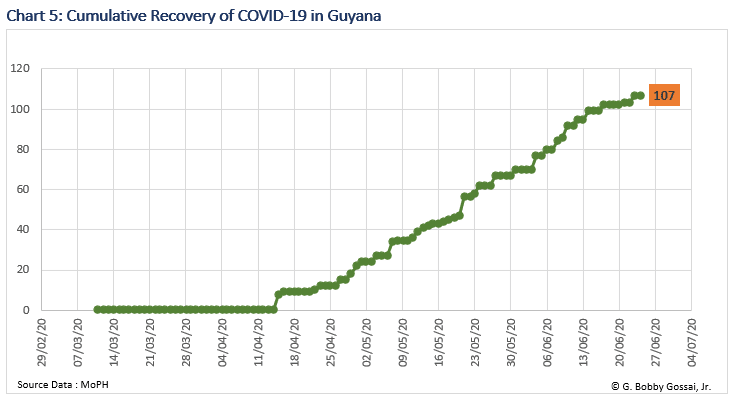
Further, the chart below features the number of persons who have recovered from the coronavirus since March to June. Over the reporting period, 107 persons in Guyana have been able to recover from the virus. This is a demonstration that over 51% of all of the confirmed cases have been able to have a full recovery.
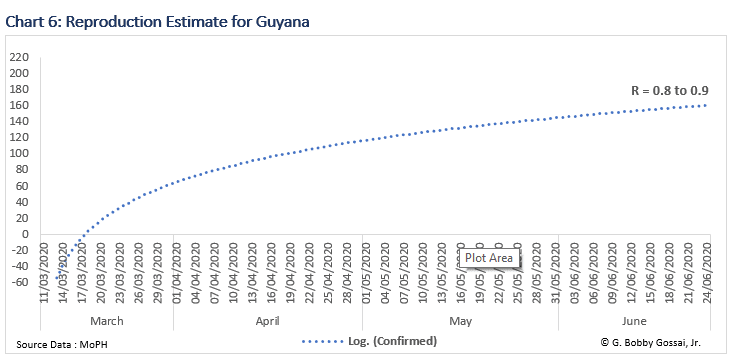
The reproduction number (R) is the average number of secondary infections produced by 1 infected person. The estimated R for Guyana was done using the number of confirmed cases over the given period of March to June and by applying a logarithmic model. The growth rate reflects how quickly the number of infections is changing day by day. It is an approximation of the change in the number of infections each day. If the growth rate is greater than zero (+ positive), then the disease will grow. If the growth rate is less than zero (- negative) then the disease will shrink. The R estimate from the data for Guyana has been stable at around 0.8 to 0.9 over the measured period.
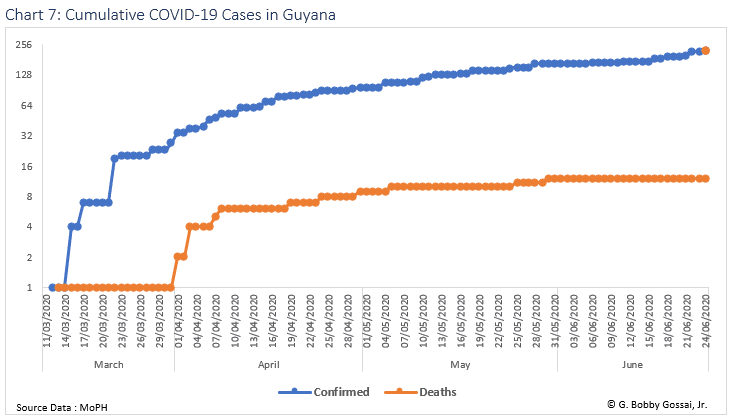
The chart above illustrates the cumulative number of COVID-19 cases in Guyana over the period of March to June. It depicts the trend of growth of the coronavirus over a logarithmic scale to show the development of the virus over time.
As can be seen from the trend-line of the confirmed cases, the curve for Guyana is still at an increasing phase.
